


Commercial Supply Chain Dynamics, Margin Structure, and Sourcing Optimization in Australia
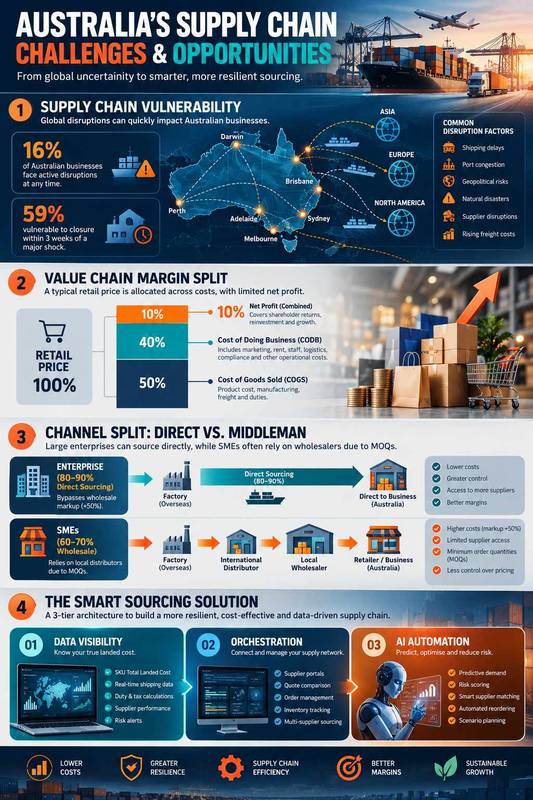
Australian enterprises face severe restocking vulnerabilities and long-haul freight delays, leaving 59% of firms at risk of operational disruption during major supply chain shocks.
Retail and wholesale operating margins are under heavy pressure, with wholesalers adding ~50% markups and half of SME retailers operating at or below break-even due to rising labor, rent, and reverse logistics costs.
Australia’s trade profile relies heavily on bulk resource and energy exports to Asia, balanced against major imports of refined fuel, vehicles, machinery, and consumer electronics.
Large retail chains bypass intermediaries using 80% to 90% direct factory sourcing, whereas SMEs rely predominantly on local wholesalers to manage high Minimum Order Quantities (MOQs) and import compliance.
Transitioning to Smart Sourcing—using AI demand forecasting, digital supplier integration, and total landed cost calculations—allows Australian businesses to reduce landed costs by 20% to 40% and build supply resilience.
Restocking Vulnerabilities and Sourcing Friction Points
Australian commercial enterprises operate within a macroeconomic environment defined by vast geographical distances between major population centers, heavy reliance on long-haul maritime shipping corridors, and vulnerability to external trade disruptions. Operational data indicates that approximately 16% of Australian businesses experience active, ongoing supply chain disruptions at any given time1. The operational strain of these disruptions is unevenly distributed across the national economy, with primary production, industrial manufacturing, and wholesale distribution bearing the heaviest burden1.
| Industry Sector | Proportion of Businesses Facing Active Disruption (%) | Primary Operational Vulnerability |
| Agriculture, Forestry, and Fishing | 35% | Exposure to fuel price volatility, freight transit delays, and climate disruptions1. |
| Manufacturing | 28% | Raw material supply bottlenecks, international input dependency, and lead-time drift1. |
| Wholesale Trade | 27% | Bulk import delays, rising holding costs, and upstream inventory allocation limits1. |
| Retail Trade | 22% | Stockout risk, seasonal inventory misalignment, and volatile reverse logistics volumes1. |
The systemic financial fragility created by these disruptions is substantial. Structural evaluations reveal that 59% of Australian enterprises would face severe operational impairment or closure within three weeks of a major supply chain shock3. Furthermore, a mere 5% of domestic firms maintain sufficient buffer stock and procurement flexibility to sustain continuous operations for a four-to-six-month period during sustained global trading shocks5. This vulnerability stems from decades of strict adherence to hyper-lean, Just-In-Time (JIT) inventory strategies that prioritized short-term capital minimization over operational resilience6.
A complex array of macroeconomic and operational friction points restricts the ability of Australian businesses to restock efficiently and source emerging product trends. Upstream geopolitical volatility remains a primary driver of risk, with 55% of Australian business leaders identifying international tensions as the main cause of supply chain fragility8. Fuel price fluctuations compound these pressures; when facing energy and transport price surges, 44% of commercial entities absorb the extra landed costs internally at the expense of profitability, while 15% pass these costs directly to business buyers through price increases1.
Compounding these international freight challenges are domestic labor shortages, with 69% of Australian enterprises anticipating operational disruptions caused by ongoing workforce deficits across the logistics, transport, and warehousing sectors6. These staffing deficits delay customs processing, extend port dwell times, and slow domestic linehaul transit. Furthermore, domestic supply chain transparency remains exceptionally low across Australian industry, as only 9% of organizations report maintaining high end-to-end visibility across their multi-tier supplier networks6. Consequently, procurement teams frequently react to inventory depletion after stockouts occur rather than deploying predictive restocking models6.
Domestic regulatory fragmentation adds another layer of operational friction. Inconsistent cross-state transport regulations, environmental compliance standards, and packaging mandates create significant administrative overhead, with regulatory complexity costing the Australian economy an estimated $160 billion annually10. Within the retail sector alone, regulatory inefficiencies are projected to inflict $26 billion in economic friction over the coming decade, diverting vital capital away from inventory expansion and supply modernization10.
The rapid growth of e-commerce—where online sales now exceed $63 billion and represent roughly 18% to 20% of total retail trade—has introduced additional operational strain through reverse logistics6. Return rates in high-velocity sectors such as apparel reach as high as 30%2. Processing a single return incurs costs ranging between 20% and 65% of the item’s original retail value, while reverse logistics expenditures absorb an average of 8.1% of total sales revenue, eroding already compressed operating margins2. In response to these operational headwinds, Australian industrial operators are executing a structural pivot away from pure JIT frameworks toward resilient “Just-In-Case” buffer stock models, supplier diversification, and regional nearshoring6.
Value Chain Financials: Wholesale and Retail Margin Mechanics
Understanding how Australian enterprises navigate cost inflation requires a detailed examination of margin allocation across the commercial value chain. Price formation from factory production to final consumer sale reflects a series of risk-adjusted markups designed to absorb freight, holding, compliance, and labor expenditures13.
Macroeconomic input-output modeling by the Reserve Bank of Australia (RBA) indicates that approximately 50% of the final retail price of a physical consumer good is absorbed by the direct Cost of Goods Sold (COGS)14. The remaining 50% represents the gross margin shared between intermediate distributors (wholesalers) and final sellers (retailers)14. This gross margin covers the overall Cost of Doing Business (CODB)—which accounts for 40% of the final price split evenly between direct labor costs (20%) and intermediate inputs such as rent, transport, utilities, and marketing (20%)—leaving a combined net profit margin for distributors and retailers of approximately 10% of the final sale price14.
Wholesalers operate as essential risk-absorbing intermediaries within the national market by acquiring bulk factory shipments, managing customs clearance, financing international inventory in transit, and breaking bulk for localized distribution13. To cover operating overheads and maintain inventory pipelines, Australian wholesalers typically apply a markup of approximately +50% over landed procurement costs13. This markup yields a gross profit margin of 30% to 33% on wholesale trade sales13. In specialized wholesale sectors, such as commercial wine export distribution, gross margins average 32%16. However, because wholesalers bear substantial warehousing costs, trade credit risk, and inventory holding expenses, net operating profit margins in core wholesale distribution remain modest, typically hovering between 2% and 4%17.
Downstream retailers apply gross markups structured to reflect category velocity, inventory holding risk, floor-space productivity, and product obsolescence rates14. Gross margin targets vary significantly across Australian retail sectors:
| Retail Sector / Category Vertical | Average Gross Margin (%) | Commercial Cost Drivers & Margin Mechanics |
| Apparel, Footwear, & Fashion | 44.9% – 50.0% | High seasonal trend turnover, deep promotional markdowns, and severe reverse logistics costs require wider gross margins to maintain baseline profitability2. |
| Mattresses & Specialty Home Goods | 60.0% – 65.7% | High spatial footprint requirements in warehousing, slow stock turnover cycles, and elevated customer acquisition costs require wide margins19. |
| Vending & Automated Fast-Flow | 40.0% – 60.0%+ | Beverage gross margins exceed 60%, offsetting high route labor, site rental commissions, machine capital expenditure, and tap-and-go payment fees20. |
| Snack Foods & Convenience Retail | 40.0% | High foot traffic and rapid inventory velocity compensate for lower unit gross margins relative to high-end specialty consumer goods20. |
| Online Consumer Electronics | 15.0% – 20.0% | Highly commoditized products with extreme price transparency; thin margins require automated, lean fulfillment operations to deliver net profitability22. |
| Fast-Moving Consumer Goods (Grocery) | 25.0% – 30.0% | Low gross margins offset by massive transactional throughput, rapid inventory turn rates, and direct-to-factory supply deals managed via centralized distribution centers13. |
Despite operating gross margins that appear sufficient, net commercial profitability across Australian retail is severely constrained by rising operational overheads. Approximately 50% of Australian small-to-medium retail enterprises (SMEs) operate at or below break-even levels10. Spikes in award wages, commercial lease rates, insurance premiums, energy costs, and average retail inventory shrinkage rates of 1.6% eat away at gross profit10. Consequently, 72% of SME owners identify escalating operating costs as the single greatest threat to business viability, with 64% reporting lower year-on-year net profits10.
Australia’s International Trade Profile: Core Imports and Exports
Australia’s international macroeconomic position is characterized by an export profile heavily reliant on primary mineral extraction, energy commodities, and agricultural yields, offset by an import profile concentrated in refined fuels, capital machinery, passenger transport, and consumer goods26.
Top Imported Goods
Australia’s import requirements reflect limited domestic industrial manufacturing capacity in electronics, heavy machinery, automotive assembly, and chemical processing27. The nation relies on specialized international supply hubs for capital inputs and finished goods:
| Import Category Rank | Commodity Description | Annual Trade Value (AUD) | Primary Source Markets | Strategic Economic Function |
| 1 | Refined Petroleum | $46.8 Billion | Singapore, South Korea, Japan | Baseline fuel input for domestic transport, heavy freight, mining, and agricultural operations27. |
| 2 | Motor Vehicles & Auto Parts | $44.4 Billion | Japan, Thailand, Germany | Essential transport equipment for commercial logistics fleets, passenger mobility, and growing EV adoption27. |
| 3 | Machinery & Mechanical Gear | $42.3 Billion | China, United States, Germany | Capital inputs supporting major civil infrastructure, mining projects, and manufacturing automation27. |
| 4 | Pharmaceutical Products | $18.3 Billion | United States, Switzerland, Germany | Essential healthcare inputs, clinical treatments, specialized biologics, and retail pharmacy supply27. |
| 5 | Electrical Machinery & Equipment | $16.7 Billion | China, Japan, South Korea | Core hardware powering energy grid modernization, smart building automation, and consumer devices27. |
| 6 | Computers & Office Electronics | $14.8 Billion | China, United States, Vietnam | Digital hardware driving corporate enterprise operations, cloud computing infrastructure, and remote work27. |
| 7 | Mining & Construction Equipment | $11.4 Billion | United States, Japan, Germany | Specialized heavy earthmoving machinery vital for natural resource extraction and civil projects27. |
| 8 | Power Automation Products | $9.2 Billion | Germany, China, Sweden | Industrial hardware for manufacturing automation, renewable energy connections, and grid control27. |
| 9 | Audio-Visual Equipment | $8.5 Billion | China, South Korea, Malaysia | Commercial displays, consumer entertainment hardware, and workplace communications infrastructure27. |
Top Exported Goods and Services
In contrast to its import mix, Australia generates substantial trade surpluses through high-volume bulk resource extraction, energy supply, and international service exports27. Iron ore remains the nation’s premier physical export commodity, generating over $63 billion in annual export value, primarily servicing East Asian industrial steelmakers28. Metallurgical and thermal coal exports contribute an additional $57.1 billion annually, supporting regional power grids and industrial metallurgy28. Liquefied natural gas (LNG) represents another major export, providing energy security to major Asian utilities28. In the agricultural domain, high-value bulk exports of beef, wheat, dairy products, wine, and wool generate significant international revenues16. In service sectors, international education exports surpass $30.3 billion annually, representing the nation’s leading non-resource trade export28.
Regional Trade Partner Dynamics
Australia’s export economy is integrated into the Asia-Pacific region, with Asian destinations receiving between 57% and 70% of total export value28. Mainland China is Australia’s largest single export destination, absorbing US26.2 billion), the United States (US
20.2 billion)29. Australia maintains strong bilateral trade surpluses with China (US
10.4 billion), and the United Kingdom (US
8.8 billion deficit), Thailand (-US
7.3 billion)29.
Middleman versus Direct Sourcing: Channel Dynamics and Market Splits
A critical strategic determinant of commercial profitability is the division between indirect procurement—utilizing intermediaries such as wholesalers, sales agents, and import brokers and direct-to-factory sourcing13.
The Australian marketplace exhibits a clear structural split in sourcing pathways based on business size, capital resources, and order volume13. Large enterprise retailers, such as Bunnings, Woolworths, Kmart, and JB Hi-Fi, conduct 80% to 90% of their product sourcing through direct factory relationships13. By bypassing wholesale intermediaries, operating proprietary national distribution centers (DCs), and managing internal cross-border logistics, these enterprise entities eliminate external wholesale markups (+50%) to maximize retail margin retention13.
Conversely, small-to-medium enterprises (SMEs) rely heavily on wholesale intermediaries, with an estimated 60% to 70% of procurement transactions passing through local distributors or semi-indirect channels13. SMEs are frequently excluded from direct factory procurement due to high factory Minimum Order Quantity (MOQ) requirements, complex international shipping logistics, trade finance constraints, and foreign compliance risks13. To balance these channel trade-offs, many commercial equipment suppliers adopt a split-distribution strategy13. Under this model, manufacturers service tier-1 enterprise accounts directly to maintain price competitiveness, while offloading regional SME accounts to local stocking distributors, protecting internal sales margins while ensuring broad distribution reach across regional Australia13.
| Sourcing Channel Model | Typical Cost Mechanics & Fee Structure | Key Operational Advantages | Major Operational Disadvantages |
| Direct Factory Sourcing | Lowest base unit purchase cost; zero intermediary price markup13. | Maximum gross margin retention; full control over branding, specs, and packaging13. | High MOQs; full absorption of shipping, holding, customs, and defect risks13. |
| Import Commission Agents | Agent takes a 5% to 15% commission fee; supplier retains price control13. | Lower overhead than wholesalers; localized contract negotiation and factory audits13. | Agent performance variable; buyer retains shipping, inventory, and tariff risks13. |
| Stocking Wholesalers | Wholesale markup of +50% over COGS (~33% gross margin)13. | Low MOQs; local stock availability; immediate delivery; local trade credit13. | Highest landed unit cost; reduced gross profit potential for final retailers13. |
The rapid expansion of B2B e-commerce platforms in Australia—projected to grow at a compound annual growth rate (CAGR) of 19.5% through 2030—is reshaping traditional middleman channels35. Digital B2B marketplaces enable mid-tier retailers to join aggregated buyer pools, secure semi-direct factory pricing, and utilize automated digital procurement tools, lowering unit landed costs without requiring large enterprise capital32.
Strategic Value of Smart Sourcing and Digital Procurement
To overcome restocking delays, landed cost inflation, and margin compression, leading Australian commercial entities are shifting from traditional, purchase-order-centric procurement toward data-driven Smart Sourcing frameworks9. Traditional procurement focuses on negotiating unit purchase prices on individual orders, often ignoring total landed costs, shipping variance, and inventory holding risks9. In contrast, Smart Sourcing integrates machine learning, multi-tier supply chain visibility, and dynamic landed cost tracking to optimize unit economics and supply resilience9.
The architecture of a Smart Sourcing operation consists of three structural layers9:
- Data Visibility Foundation: Captures real-time landed costs at the specific SKU level9. Rather than evaluating simple factory purchase prices, the system continuously calculates unit price, ocean/air freight rates, tariff charges, customs clearance fees, insurance, and last-mile domestic transport9.
- Process Orchestration Layer: Deploys collaborative supplier portals, automated e-sourcing platforms, and integrated Contract Lifecycle Management (CLM) tools9. This framework facilitates real-time data sharing regarding production schedules, lead-time drift, and quality control metrics9.
- Intelligence & Automation Layer: Applies machine learning (ML) models for predictive demand forecasting, dynamic reorder points, and automated supplier risk scoring9. Advanced implementations utilize supply chain “digital twins” to run scenario simulations—such as port shutdowns, raw material cost surges, or tariff adjustments—allowing procurement teams to execute proactive risk mitigation9.
Transitioning to Smart Sourcing delivers tangible operational and financial advantages for Australian commercial enterprises. By prioritizing Total Landed Cost (TLC) transparency, organizations eliminate hidden freight charges and margin leakage, achieving landed cost reductions between 20% and 40% compared to traditional distributor pricing structures38. Furthermore, predictive demand forecasting reduces stockout frequency while accelerating inventory turnover, preventing working capital from being tied up in slow-moving inventory9.
Australian retailers are rapidly adopting these digital capabilities. Data indicates that 80% of Australian e-commerce businesses now deploy AI tools within their operations, with 33% having fully integrated AI systems and 47% actively testing implementations41. The application of machine learning in real-time supplier risk tracking (53%) and predictive cost modeling (50%) is generating measurable improvements in operational resilience5. Additionally, Smart Sourcing platforms automatically evaluate Free Trade Agreements (FTAs) and country-of-origin rules, allowing procurement teams to dynamically re-route sourcing orders away from high-tariff jurisdictions toward lower-cost regional trading partners across the Asia-Pacific5.
| Sourcing Performance Dimension | Traditional Procurement Model | Smart Sourcing Framework |
| Primary Decision Metric | Unit Purchase Order (PO) Price9. | Total Landed Cost (TLC) per unit9. |
| Demand Forecasting Method | Historical spreadsheet modeling & reactive reordering9. | Machine Learning (ML) predictive demand models9. |
| Supply Chain Visibility | Limited; manual tracking of major freight legs6. | Real-time multi-tier network visibility6. |
| Risk & Disruption Response | Reactive problem-solving following stockout6. | Proactive scenario modeling via digital twin simulation9. |
| Supplier Engagement | Transactional, price-focused negotiations9. | Continuous collaboration via integrated portals9. |
| Tariff & Duty Mitigation | Static order execution; manual tariff audits39. | Automated order re-routing to tariff-favored FTA hubs39. |
Conclusions and Strategic Recommendations
The Australian commercial sector faces a landscape marked by inherent supply chain vulnerabilities, elevated domestic costs of doing business, and shifting margin dynamics. The reliance on lean Just-In-Time inventory models has exposed 59% of domestic firms to operational failure within three weeks of major supply chain shocks3. Furthermore, while gross retail margins appear healthy in sectors like apparel and specialty homewares, rising overheads in labor, commercial rent, utilities, and reverse logistics compress net profitability, leaving roughly half of Australian small-to-medium retailers operating at or near break-even2.
To safeguard operating margins, build inventory resilience, and capitalize on emerging commercial trends, executive leadership across Australian retail, wholesale, and manufacturing sectors should implement four core strategic actions:
First, procurement operations must transition from purchase order unit pricing to dynamic Total Landed Cost (TLC) evaluation9. Supply chain calculations must account for the full spectrum of landed expenses—including volatile ocean freight rates, tariff structures, customs clearance fees, localized transit charges, and reverse logistics return costs—before setting downstream retail prices or signing vendor contracts2.
Second, enterprise investments should prioritize predictive supply chain technology, machine learning, and automated data integration5. Adopting digital supplier portals, predictive demand forecasting algorithms, and real-time shipment tracking will address current visibility gaps, enabling procurement teams to identify lead-time drift and reorder stock proactively before critical shortages occur6.
Third, organizations must optimize their sourcing channel mix by balancing direct factory relationships with strategic distribution partners13. Where ordering volume permits, businesses should leverage direct factory sourcing or digital B2B buying groups to capture lower base pricing and bypass intermediate markups13. For lower-volume SKUs or unpredictable product lines, businesses should maintain structured relationships with local stocking wholesalers to preserve working capital while securing stock availability13.
Finally, Australian enterprises must build multi-tiered regional supply chain resilience to mitigate geographic and geopolitical risk5. Shifting focus away from single-source offshore dependencies toward diversified regional manufacturing hubs across the Asia-Pacific will shorten ocean transit times, maximize Free Trade Agreement (FTA) utilization, and shield business operations against global supply shocks5.
Works cited
- Business Conditions and Sentiments, June 2026, https://www.abs.gov.au/statistics/economy/business-indicators/business-conditions-and-sentiments/latest-release
- Is the Returns Model Breaking? – ASCLA – Australasian Supply, https://www.ascla.org/is-the-returns-model-breaking/
- Proxima: Australian companies highly vulnerable to supply chain, https://www.consultancy.com.au/news/12382/proxima-australian-companies-highly-vulnerable-to-supply-chain-shocks
- Almost 60 percent of Australian businesses would fold within three, https://procurementandsupply.com/almost-60-percent-of-australian-businesses-would-fold-within-three-weeks-of-major-supply-shock/
- Australian Businesses Among Most Fragile in Supply Chain, https://econews.com.au/australian-businesses-among-most-fragile-in-supply-chain-resilience-new-report/
- Australian Supply Chains: Why 2026 Marks the Shift from Lean to, https://cliquelogistics.com.au/australian-supply-chains-why-2026-marks-the-shift-from-lean-to-resilient-operations/
- Australian Manufacturing Supply Chains 2026: What the Data Shows, https://www.ecisolutions.com/en-au/blog/manufacturing-supply-chain-shift/
- Australian businesses warn of supply chain & cost pressure, https://ecommercenews.com.au/story/australian-businesses-warn-of-supply-chain-cost-pressure
- Smart Sourcing Strategies for D2C Beauty & Wellness Brands, https://www.cognitute.org/insights/smart-sourcing-strategies-for-d2c-brands
- Policy Blueprint 2026 – Australian Retailers Association, https://www.retail.org.au/wp-content/uploads/ARC-Policy-Blueprint-2026.pdf
- 2023 Inside Australian Online Shopping – Australia Post, https://auspost.com.au/content/dam/auspost_corp/media/documents/inside-australian-online-shopping-ecommerce-report-2023.pdf
- Retail Data Analytics: Offshore BI Teams for Australian Retailers, https://www.satelliteoffice.com.au/blog/retail-data-analytics-building-offshore-bi-teams-for-australian-retailers/
- Understanding Distribution strategy options in the Australian market, https://jwpm.com.au/reference/understanding-distribution-strategy-options-in-the-australian-market
- Costs and Margins in the Retail Supply Chain, https://www.rba.gov.au/publications/bulletin/2012/jun/pdf/bu-0612-2.pdf
- Plano de Negócio para Marca de Moda: Estrutura e Orçamento, https://www.texteis.org/blog/plano-negocio-marca-moda/
- Commercial Viticulture & Premium Agribusiness Export Digital, https://www.igrowix.com/blog/commercial-viticulture-wine-export-agribusiness-web-platforms-adelaide-au
- Drug Wholesaling Moves to Fee for Service, http://www.pembrokeconsulting.com/pdfs/Fein-LehmanInterview-Jan2004.pdf
- frasers group plc annual report 2023. – Netlify, https://frasers-cms.netlify.app/assets/fg-annual-report-2023-web.pdf
- Prospectus – The Koala Company Limited (ASX:KOA) – Listcorp, https://www.listcorp.com/asx/koa/the-koala-company-limited/news/prospectus-3333955.html
- best vending machine suppliers in Brisbane Australia, https://vendingreview.blog/blog/3172.html
- 170+ Convenience Statistics | Verified 2026 – Gitnux, https://gitnux.org/convenience-statistics/
- Yatango Prospectus 15.indd – ASX, https://www.asx.com.au/asxpdf/20150701/pdf/42zkjstn41blkd.pdf
- Public Agricultural Research in an Era of Transformation, https://iaes.cgiar.org/sites/default/files/pdf/syntetic-study-web_def.pdf
- Supermarkets inquiry 2024-2025 Interim report | ACCC, https://www.accc.gov.au/system/files/supermarkets-inquiry-2024-2025-interim-report.pdf
- Grocery inquiry report – July 2008.pdf – ACCC, https://www.accc.gov.au/system/files/Grocery%20inquiry%20report%20-%20July%202008.pdf
- International Finance Report Australia 2024: Trade Balance & FDI, https://www.studocu.vn/vn/document/truong-dai-hoc-kinh-te-thanh-pho-ho-chi-minh/tai-chinh-quoc-te/international-finance-report-australia-2024-trade-balance-fdi-analysis/126963062
- Top 10 Imports and Exports in Australia – Couriers and Freight, https://www.couriersandfreight.com.au/blog/top-10-imports-and-exports-in-australia
- Australia Export & Investment Trends 2015-2025 | PDF – Scribd, https://www.scribd.com/document/904509177/IA2-Research-Report-FINAL
- Australia’s Top Trading Partners 2025 – World’s Top Exports, https://www.worldstopexports.com/australias-top-import-partners/
- China Sourcing without Middlemen: How to Buy and When Not To, https://change-sourcing.com/china-sourcing-without-middlemen/
- Ipad 10th Generation Case Kmart – Elearning, https://elearning.asc.edu.ag/ipad-10th-generation-case-kmart
- Phone Accessories Wholesale Market 2026: Key Trends & Data, https://www.bwoohk.com/blog/industry-insight/phone-accessories-wholesale-market.html
- Top 30 Toiletry Bag Manufacturers For Private Label Travel Brands, https://www.ciffnoo.com/toiletry-bag-manufacturer/
- How to Buy Direct from China Suppliers from Australia – Wise, https://wise.com/au/blog/buying-direct-from-china-suppliers
- B2B E-commerce in Australia: How to Scale Strategically – Stripe, https://stripe.com/nz/resources/more/b2b-ecommerce-in-australia
- B2B E-Commerce Market to Reach USD 82,473 Billion by 2032 |, https://www.globenewswire.com/news-release/2025/02/18/3028051/0/en/b2b-e-commerce-market-to-reach-usd-82-473-billion-by-2032-sns-insider.html
- Australia E-Commerce Market Size, Share & Growth 2035, https://www.expertmarketresearch.com/reports/australia-e-commerce-market
- Construction Material Sourcing in 2026: Strategies That Cut Costs, https://tryflume.ai/blog/construction-material-sourcing
- 8 Steps to Minimize Tariff Impact on Your Business – Resilinc, https://resilinc.ai/blog/8-steps-minimize-tariff-impact-your-business/
- How to Choose a PLC for Automation: A Practical Selection Guide, https://instrodirect.com.au/how-to-choose-a-plc-for-automation-a-practical-selection-guide/
- Australian ecommerce leads the charge in mass AI adoption, https://www.retail.org.au/media/new-research-australian-ecommerce-leads-the-charge-in-mass-ai-adoption
- What Are Tariffs? Understanding How Tariffs Work | FedEx Australia, https://www.fedex.com/en-au/small-business/adapt-innovate/what-are-tariffs-understanding-tariffs.html
- The August 1st Tariff Shift: What Fashion Brands Need to Know, https://world-collective.com/blogs/news/august-tariff-updates
- Blog | Elisa Industriq, https://www.elisaindustriq.com/resources/blog
